Use case advising on sea-level rise data to a company investing in a coastal resort in Lagos
Starting point
An environmental consultant is commissioned to provide information of available data on sea-level rise to a company investing in a coastal resort in Lagos - a touristic city in the south of Portugal – for the purposes of conduct a riskrisk
often taken to be the product of the probability of an event and the severity of its consequences. In statistical terms, this can be expressed as Risk(Y)=Pr(X) C(Y|X), where Pr is the probability, C is the cost, X is a variable describing the magnitude of the event, and Y is a sector or region.
analysis of flooding due to climate changeclimate change
Climate change refers to a change in the state of the climate that can be identified (e.g., by using statistical tests) by changes in the mean and/or the variability of its properties, and that persists for an extended period, typically decades or longer. Climate change may be due to natural internal processes or external forcings such as modulations of the solar cycles, volcanic eruptions and persistent anthropogenic changes in the composition of the atmosphere or in land use. Note that the United Nations Framework Convention on Climate Change (UNFCCC), in its Article 1, defines climate change as: 'a change of climate which is attributed directly or indirectly to human activity that alters the composition of the global atmosphere and which is in addition to natural climate variability observed over comparable time periods'. The UNFCCC thus makes a distinction between climate change attributable to human activities altering the atmospheric composition, and climate variability attributa. Accordingly, the consultant decides to provide the following information:
- Range of average sea-level rise data from the latest IPCCIPCC
Intergovernmental Panel on Climate Change. The IPCC assesses the scientific, technical and socio-economic information relevant for the understanding of the risk of human-induced climate change. for the region of interest. - First approximation of historical flood depth estimates of the 100yr storm surge for the region of interest.
The consultant opts to communicate its advice both in the form of spatial explicit maps and plots showing relevant ranges and historical flood extent.
Basic approach
The analysis comprises two tasks:
- Identify sea level rise for RCP26, RCP45 and RCP85.
- Identify flood depth extend..
Basic indicators
- Sea level rise (rcp26)
- Sea level rise (rcp45)
- Sea level rise (rcp85)
- Flood depth
CLIP-C tools featured
Map viewer, time series
Contact person
Analytical steps in detail
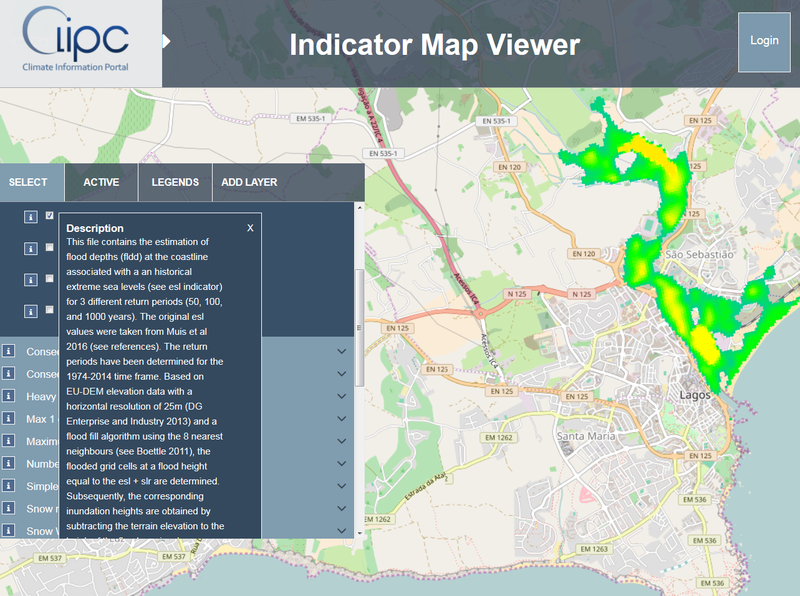
- Zoom to your region of interest.
- Select the indicator “sea level rise” under the “Ocean and Coasts” menu in the “Select” tab.
- Select the following datasets: slr_R-mean-2-5-2_PIK_ens-multiModel-mean-rcp26_avg_20500101-21000101_ 1986-2005; slr_R-mean-2-5-2_PIK_ens-multiModel-mean-rcp45_avg_20500101-21000101_ 1986-2005 and slr_R-mean-2-5-2_PIK_ens-multiModel-mean-rcp85_avg_20500101-21000101_ 1986-2005
- Adjust the transparency to 50% in the “Active” tab by choosing the “opacity” option.
- In the “Active” tab select the “time series” function.
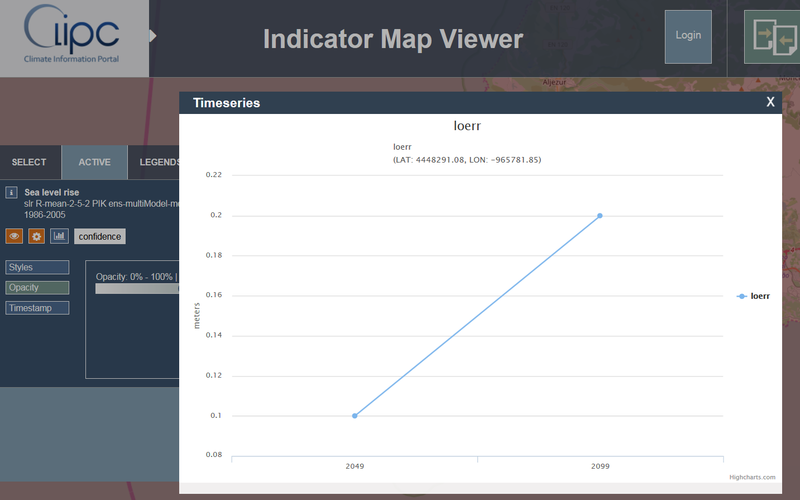
- Now click on the map in an ocean area close to the city of interest. A plot will appear showing the 2048 and 2099 average sea-level rise according to the dataset chosen (in the example below the plot refers to the dataset of RCP26 (see section 2 on reading datasets on CLIPC)).
- Proceed by doing the same analytical steps for the remaining sea-level datasets (RCP45 and RCP85) and pointing down the respective estimates for 2049 and 2099.
- In the “Select” tab now chose “Precipitation and Floods” the indicator the “100 year flood return level” and the “historical flood depth in the absence of coastal protection”.
- Navigate to the region of interest and explore the estimate flood depth extent. If you want to know in depth details on how the data as created, consult the “i” button neighbouring each dataset.