D7.2 The use of impact functions to develop Tier 2 and 3 indicators in CLIPC
Objectives: 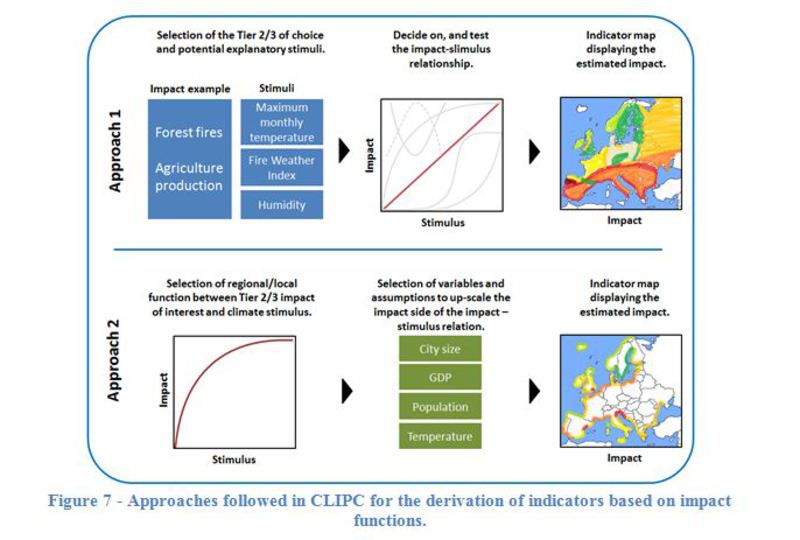
The objective of this deliverable is twofold. First, the deliverable reviews the methodological challenges of generating impact functions. An impact function is described as a quantitative relationship between a climateclimate
Climate in a narrow sense is usually defined as the average weather, or more rigorously, as the statistical description in terms of the mean and variability of relevant quantities over a period of time ranging from months to thousands or millions of years. The classical period for averaging these variables is 30 years, as defined by the World Meteorological Organization. The relevant quantities are most often surface variables such as temperature, precipitation and wind. Climate in a wider sense is the state, including a statistical description, of the climate system. or climate related stimulus (e.g., temperature or floodflood
The overflowing of the normal confines of a stream or other body of water, or the accumulation of water over areas that are not normally submerged. Floods include river (fluvial) floods, flash floods, urban floods, pluvial floods, sewer floods, coastal floods, and glacial lake outburst floods.
depth), and an ecological or socio-economic variable (e.g., economic loss or species distribution). The review identifies two approaches for establishing impact functions that can be used in CLIPC for the development of additional impact indicators. The first approach is based on establishing a statistical relationship between a climate variable, or Tier 1 indicator, and a measure of socio-economical or ecological impact for a particular large region, e.g. Europe-wide. Because socio-economic and ecological data is not always available across Europe at a temporal or spatial resolutionresolution
In climate models, this term refers to the physical distance (meters or degrees) between each point on the grid used to compute the equations. Temporal resolution refers to the time step or the time elapsed between each model computation of the equations. required for a statistical assessment, a second approach was established. The latter uses impact functions that have been derived from statistics for a particular location and scale these up, either using additional variables or generalized assumptions, so that the function can be used at much larger spatial scales than that for which it was originally developed. In order to demonstrate potential applications, three impact indicators for CLIPC are elaborated these are: Moth PhenologyPhenology
The relationship between biological phenomena that recur periodically (e.g., development stages, migration) and climate and seasonal changes. Indicator, Threshold Mortality Temperatures, and Potential Economic Damages from Coastal Flooding.
Although work on the new indicators is still preliminary, it serves to highlight the benefits, and also challenges, of using impact functions to generate impact indicators. Therefore, the benefits, uncertainties, saliency, legitimacy, and credibility of each additional indicator are also described. The potential inclusion of each indicator in the CLIPC portal is discussed.
Results:
The indicators developed using impact functions are: Moth Phenology Indicator, Threshold Mortality Temperatures, and Potential Economic Damages from Coastal Flooding. These new indicators illustrate the approach and have a number of useful characteristics for potential users of the CLIPC portal.
The Moth Phenology Indicator illustrates that it is possible to project the timing of peak flight periods of moths using temperature observations and satellite data. The use of remotely-sensed variables (snow melt, greening) in the impact function makes it possible to determine the phenology of species over large geographic areas. Potentially practical applications include the management of pest insect populations in a changing climate.
The Threshold Mortality Temperatures indicator allows better contextualizing of heat data than purely temperature based indicators such as number of hot days (Tier 1 indicator). This shows that the salience and relevance of the temperature information can be increased through impact functions. Thus, the actual impacts on the population of a change in, for example, the number of hot days, will depend on the minimum human mortality temperatures. The indicator can therefore be interpreted as the current level of tolerance to heat by the population. Another asset of the indicator is that it provides a first order approximation of threshold temperatures in locations where so far no specific heat-mortality study has been conducted.
The Potential Economic Damages from Coastal Flooding indicator is determined via a systematic transformation of location-specific surge heights into an estimate of economic damages associated with different land-uses. The impact function estimates economic damages derived for specific areas can be generalised and compared with existing observations of economic losses from insurance or disaster data covering wider areas. In this manner, it opens the way for indicator validation. Using the empirical damage functions associated with different types of land-use and time horizons allows the support of discussions on urban adaptationadaptation
The process of adjustment to actual or expected climate and its effects. In human systems, adaptation seeks to moderate harm or exploit beneficial opportunities. In natural systems, human intervention may facilitate adjustment to expected climate and its effects. to coastal flooding by highlighting different levels of adaptation, including actions that modify the function itself through preventive measuresmeasures
In climate policy, measures are technologies, processes, and practices that contribute to mitigation, for example renewable energy technologies, waste minimization processes and public transport commuting practices. at the land-use scale that change the response between flood depth and economic damage.
Perspectives:
The approach described in this report suggests that the development and use of impact functions is a feasible and attractive way of increasing the relevance and salience of purely physical indicators of climate changeclimate change
Climate change refers to a change in the state of the climate that can be identified (e.g., by using statistical tests) by changes in the mean and/or the variability of its properties, and that persists for an extended period, typically decades or longer. Climate change may be due to natural internal processes or external forcings such as modulations of the solar cycles, volcanic eruptions and persistent anthropogenic changes in the composition of the atmosphere or in land use. Note that the United Nations Framework Convention on Climate Change (UNFCCC), in its Article 1, defines climate change as: 'a change of climate which is attributed directly or indirectly to human activity that alters the composition of the global atmosphere and which is in addition to natural climate variability observed over comparable time periods'. The UNFCCC thus makes a distinction between climate change attributable to human activities altering the atmospheric composition, and climate variability attributa (i.e. Tier 1 indicators). Impact functions can also be used to scale up detailed information from Tier 2 or Tier 3 indicators developed for specific locations to cover wider areas. Such indicators have been developed and published in the scientific literature by various authors, but the data are generally not publicly available and can therefore not easily be included in CLIPC.
Caution is warranted in interpreting indicators based on impact functions as there are significant uncertainties related to the data, the choice and estimation of the impact function and the attribution of impacts to climate change. But because of the attractiveness of enabling users to explore new impact indicators in a quick way on their own, it is recommended to further explore opportunities for combining Tier 1 indicators with other information to produce Tier 2 and 3 indicators based on impact functions. However, despite some promising work the challenges in using impact function for constructing higher Tier indicators should not be underestimated. This report provides ideas for how indicators can be generated using impact functions, but the specific methods will depend strongly on the nature of the impact to be evaluated and on the availability of data.