Model data
ClimateClimate
Climate in a narrow sense is usually defined as the average weather, or more rigorously, as the statistical description in terms of the mean and variability of relevant quantities over a period of time ranging from months to thousands or millions of years. The classical period for averaging these variables is 30 years, as defined by the World Meteorological Organization. The relevant quantities are most often surface variables such as temperature, precipitation and wind. Climate in a wider sense is the state, including a statistical description, of the climate system
models produce an enormous amount of data. A global climate model (GCM) may include 2 to 3 million grid boxes. Every time step in a simulation produces the state of all different variables in each grid box. Taking into account that simulations are usually done for periods over 100 years, it is easily understood that data handling takes a lot of resources. It is not possible to store all calculations, therefore before running a scenarioscenario
A plausible description of how the future may develop based on a coherent and internally consistent set of assumptions about key driving forces (e.g., rate of technological change, prices) and relationships. Note that scenarios are neither predictions nor forecasts, but are useful to provide a view of the implications of developments and actions. See also Climate scenario, Emission scenario, Representative Concentration Pathways and SRES scenarios. , decisions on what to store have to be made.
To get a better overview of what is available, some databases group the variables into different categories. For example, the CMIP5CMIP5
Fifth Coupled Model Intercomparison Project database divides the variables into different realms: aerosols, atmosphereatmosphere
The gaseous envelope surrounding the Earth. The dry atmosphere consists almost entirely of nitrogen (78.1% volume mixing ratio) and oxygen (20.9% volume mixing ratio), together with a number of trace gases, such as argon (0.93% volume mixing ratio), helium and addiatively active greenhouse gases such as carbon dioxide (0.035% volume mixing ratio) and ozone. In addition, the atmosphere contains the greenhouse gas water vapour, whose amounts are highly variable but typically around 1% volume mixing ratio. the atmoshere also contains clouds and aerosols., land surface, land ice, ocean, ocean bio-geochemistry, and sea ice. Another possible distinction is often made between atmospheric variables that are derived from the grid representing the atmosphere, and surface variables that are produced by the surface model (surface scheme).
ResolutionResolution
In climate models, this term refers to the physical distance (meters or degrees) between each point on the grid used to compute the equations. Temporal resolution refers to the time step or the time elapsed between each model computation of the equations.
In climate models, spatial resolution refers to the physical distance (meters or degrees) between each point on the grid used to compute the equations. A GCM usually has a spatial Resolution of 100-300 km while a regional climate model (RCM) is set up with typically 10-50 km resolution. The temporal resolution of GCM ranges usually from 6-hourly data up to statistical monthly values. The RCM can produce 30-minute values (for some variables such as precipitation) up to monthly values. Sometimes even maximum and minimum values are stored.
Representativeness
It is not advisable to analyse results from individual grid cells at time-step level. The recommendation is to average data over several grid cells and preferably also over time. Climate model data is based on grid cells, one number per grid cell (per variable and time-step). GCM grid cells are 10,000-90,000 km2 and RCM grid cells are 100-2,500 km2. The climate models produce data averaged over the whole grid cell area. This means that there are substantial differences between model data and observations, both in scale and representativeness. Meteorological measurements are basically representative for a small area around the instrument. The representativeness varies depending on the variable discussed. Rain gauges are a good example. A local shower may hit the rain gauge and thus large amounts of rain are registered. It may well be so that the shower misses the rain gauge and no rain is recorded. In a climate model these local variations are averaged over the whole grid cell. So, climate model data and observations do not represent the same. Different downscalingdownscaling
Downscaling is a method that derives local- to regional-scale (10 to 100 km) information from larger-scale models or data analyses. Two main methods exist: dynamical downscaling and empirical/statistical downscaling. The dynamical method uses the output of regional climate models, global models with variable spatial resolution or high-resolution global models. The empirical/statistical methods develop statistical relationships that link the large-scale atmospheric variables with local/regional climate variables. In all cases, the quality of the driving model remains an important limitation on the quality of the downscaled information. and biasbias
The average difference between the values of the forecasts and the observations on the long term. While accuracy is always positive the bias could be either positive of negative depending on the situation.
correction methods are developed to refine climate model data. On the other hand, meteorological observation data are transformed to gridded observation data by using interpolation methods. These measuresmeasures
In climate policy, measures are technologies, processes, and practices that contribute to mitigation, for example renewable energy technologies, waste minimization processes and public transport commuting practices. are taken to overcome the obstacles to the extent possible.
UncertaintyUncertainty
Lack of precision or unpredictability of the exact value at a given moment in time. It does not usually imply lack of knowledge. Often, the future state of a process may not be predictable, such as a roll with dice, but the probability of finding it in a certain state may be well known (the probability of rolling a six is 1/6, and flipping tails with a coin is 1/2). In climate science, the dice may be loaded, and we may refer to uncertainties even with perfect knowledge of the odds. Uncertainties can be modelled statistically in terms of pdfs, extreme value theory and stochastic time series models.
Uncertainty means lack of precision or that the exact value for a given time is not predictable, but it does not usually imply lack of knowledge. Uncertainties can be modelled statistically in terms of Probability Density Functions (pdfs), extreme value theory and stochastic time series models.
To make climate projections a long chain of calculations and assumptions are made. Thus many sources of uncertainties occur: the natural climate variabilityclimate variability
Climate variability refers to variations in the mean state and other statistics (such as standard deviations, the occurrence of extremes, etc.) of the climate on all spatial and temporal scales beyond that of individual weather events. Variability may be due to natural internal processes within the climate system (internal variability), or to variations in natural or anthropogenic external forcing (external variability ). See also Climate change
, the choice of climate models and the emission scenarios.
The climate´s natural variability is large, and distinguishing between natural variability and climate changeclimate change
Climate change refers to a change in the state of the climate that can be identified (e.g., by using statistical tests) by changes in the mean and/or the variability of its properties, and that persists for an extended period, typically decades or longer. Climate change may be due to natural internal processes or external forcings such as modulations of the solar cycles, volcanic eruptions and persistent anthropogenic changes in the composition of the atmosphere or in land use. Note that the United Nations Framework Convention on Climate Change (UNFCCC), in its Article 1, defines climate change as: 'a change of climate which is attributed directly or indirectly to human activity that alters the composition of the global atmosphere and which is in addition to natural climate variability observed over comparable time periods'. The UNFCCC thus makes a distinction between climate change attributable to human activities altering the atmospheric composition, and climate variability attributa is not an easy task. All climate models are based on the same basic knowledge of the climate systemclimate system
The climate system is the highly complex system consisting of five major components: the atmosphere, the hydrosphere, the cryosphere, the lithosphere and the biosphere, and the interactions between them. The climate system evolves in time under the influence of its own internal dynamics and because of external forcings such as volcanic eruptions, solar variations and anthropogenic forcings such as the changing composition of the atmosphere and land use change. and act more or less in the same way. Despite this, the results differ from each other. The reason is that the processes in the climate system can be described in different ways, and different amounts of processes may be included in the models.
There is no such thing as a perfect model. Therefore it is important to compare results from different models. A well-functioning model is however expected to describe mean values and variability with precision. One example is the correct amount of cold and warm winters during a 30-year period; the amount, but not the sequence. The modelled winters may come in another order than the real winters. Future climate depends on future content of greenhouse gases in the atmosphere. To handle the uncertainty regarding future emissions several simulations with different emission scenariosscenarios
Scenarios can be thought of as stories of possible futures. They allow the description of factors that are difficult to quantify. In the context of climate change scenarios are used for the future development of factors such as governance, social structures, future population growth, technical development and agriculture. These descriptions are essential to model the future climate. are made, and the ensembleensemble
A collection of model simulations characterizing a climate prediciton (or projection). Differences in the initial conditions and model formulations result in different evolution of the modelled systems and may give information on uncertaitny associated with model error, error in the initial conditions and with the internally generate climate variability
of simulations and their statistics (mean, variance) are often used instead of results of just one model or simulation. One important result from model simulations is that the choice of emission scenario has very little impact on the results for the nearest decades. When reaching the middle of the century the importance of emission scenario is clearer.
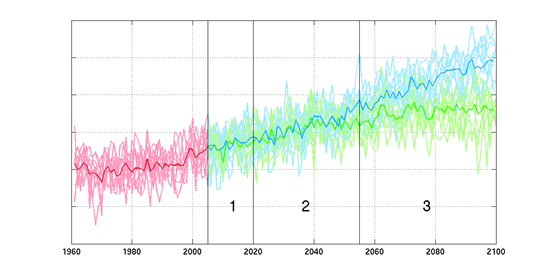
The figure describes Climate projections with two different emission scenarios. The first time period shows how well the models describe the historic climate from 1961 (red-pink). At the start of the future period (2005) it is hard to distinguish the climate signal due to natural variability. The variation between years is greater than the change in mean climate (1). Further in time the change is more visible. The mean climate is above the highest values during the historic period. During this phase the choice of model is most significant for the results (2). By the end of the century the choice of emission scenario is most important (3).